Showing posts with label gnuplot. Show all posts

Thursday, January 9, 2014

32 - Colors in Gnuplot

Sometime one needs to use different colors to depict a figure. With the knowledge of the "Hex Code" of each color in Gnuplot, we can choose our favor color to plot.

To use "Hex Code"s we do as follow
pl 'FileName.dat' u 1:2 w lp lc rgb '#HexCode'

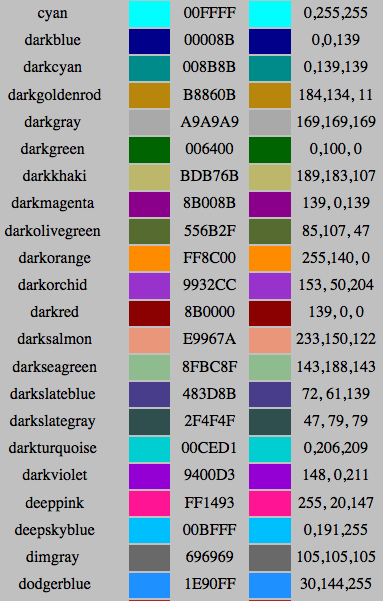
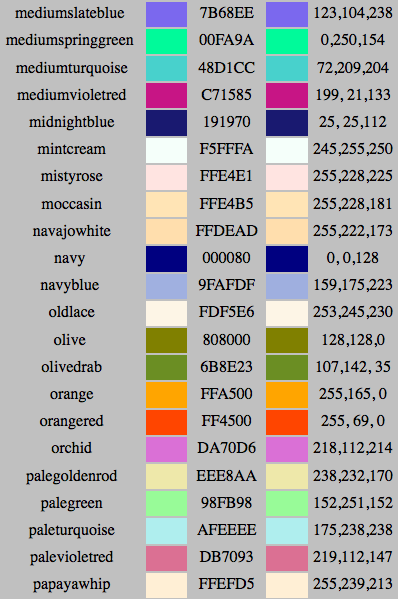
For example, the Hex Code for the blueviolet is 0000FF. The codes for each color can be found in
below figures. (From this Website)


Friday, February 22, 2013

23 - Plotting the last/first "N" lines of a data file within gnuplot

If we are interested in the last/first N lines of a data file and we would like to plot those, the needed
command in gnuplot is

> pl "< tail -N filename" u 1:2 w lp
which plots the last N lines,
or
> pl "< head -N filename" u 1:2 w lp
that plots the first N lines.

Thursday, January 10, 2013

20 - Plotting a line paralle to y axis

If you want to plot your file like 'file.dat' then you want to have a parallel line to "y" axis, you can use:

> set arrow from 0, graph 0 to 0, graph 1 nohead
> plot 'file.dat'

In this case a line, x=0, will be plotted in your figure.
It is clear that for drwing, for example, x=1 line we need to use:

> set arrow from 1, graph 0 to 1, graph 1 nohead
> plot 'file.dat'

Monday, October 8, 2012

16 - plotting of subtraction of two columns in two different files in gnuplot

Suppose that we have two different files called File1.dat and File2.dat. The first file has 4 columns and the second file has 5 columns.
Our purpose is to plot the first column in the first file respect to difference of column 3 in the File1.dat and column 4 in the File2.dat. To do this we use the following command:

pl "< paste File1.dat File2.dat" u 1:($3-$8) w l

(with using this command, we assemble all columns in a same place. Therefor we have 4+4=8 columns where the first 4 columns belong to the first file and the rest ones belong to the second file.)

Monday, August 20, 2012

14 - general command for plotting in Gnuplot!

If you wan to plot a 2D (3D), here is the general command:

pl 'file.txt' u 1:2 w lp lt 2 lw 3 pt 4 ps 2 lc 3 t 'My title'

in this command:
pl = plot
u = using
w = with
lp = line point
lt = line type
lw = line width
pt = point type
ps = point size
lc = line color
t = title

Sunday, June 3, 2012

12. Fitting data in a restricted range with Gnuplot

To to this, it is sufficient to use the following command (for example for a linear data fitting: y-ax+b)

> f(x)=a*x+b
> fit f(x) "< awk '{if($1>1 && $1<10) print $0}' data_file.txt" via a,b

Monday, May 21, 2012

11. X11 in gnuplot

If you want to see your plot in X11 window, type

set term x11

in the terminal.

Sunday, April 22, 2012

9. How can we plot only a single point using Gnuplot?

To plot a single point with using Gnuplot, it is sufficient to use the following command:

plot "< echo 'x y' "

Friday, July 29, 2011

4. Gnuplot in cluster

If you want to use gnuplot in cluster, you have to connect to cluster with e.g.

ssh -Y kiani@ifflinux

after that, you can plot your data while you are in cluster.